What We Offer
Consensus Data
Visible Alpha extracts the forecasts, assumptions and logic from full working sell-side models to create consensus data with full granularity and transparency.
Estimates and Historical Data
Our exclusive dataset VA Actuals captures historical data not found in filings or disclosed by companies. It is stitched together with forecast data for a more seamless data experience to help you predict and identify market winners.
Analyst, Company and Industry Data
We offer three levels of data:
- Analyst Data: Extracted directly from sell-side analyst models, presented as each analyst models each line item
- Company Data: Analyst data made comparable for each company, including segment-level data, key company drivers and YoY growth
- Industry Data: Company data made comparable within an industry, including all financial and operating metrics for easy relative analysis
Functions & Tools
Model Downloads and Excel Export
Download sell-side models and customize Excel exports for any company view or peer comp table
Formula Bar
With full transparency you can audit formulas, view broker information and see the logic of every consensus and broker data point
Valuation Metrics
Our unique methodology determines when valuation metrics should be composed of GAAP metrics, operating metrics or a blend of the two
Data Delivery
Web App
Customizable interface with alerts, data visualizations and direct downloads of models and earnings previews and review. Learn More >
Excel Add-In
Pull the most up-to-date data points and key metrics directly into your working model. Learn More >
API, Feeds and Cloud
A RESTful API, a file-based data feed, and cloud delivery via Snowflake for those looking for programmatic access to our content. Learn More >
Visible Alpha BioPharma
In the dynamic landscape of the pharmaceutical and biotech industries, where innovation in drug development is rapid, the demand for accurate drug data to inform investment decisions is more important than ever before.
Visible Alpha BioPharma combines comprehensive drug metadata with detailed financial information into one platform to provide an extensive view of drugs on the market and in development.
Benefit of Using Visible Alpha
Unique datasets
Visible Alpha provides immediate access to the latest consensus forecast data and historical data on granular metrics. By leveraging 128k+ financial and operating industry metrics, you can easily conduct peer analysis.
Save time
A recent client survey shows that Visible Alpha has saved analysts on average 13 hours per month when leveraging both the web app and excel add-in, so you can reinvest your time to focus on new ideas.
Personalized service & IP protection
With the ISO 27001 certification, Visible Alpha provides buy-side clients and sell-side contributors with another level of assurance to pass the rigorous audit required.
CUSTOMER QUOTES
Visible Alpha Insights is the consensus tool of choice for many global investment firms.
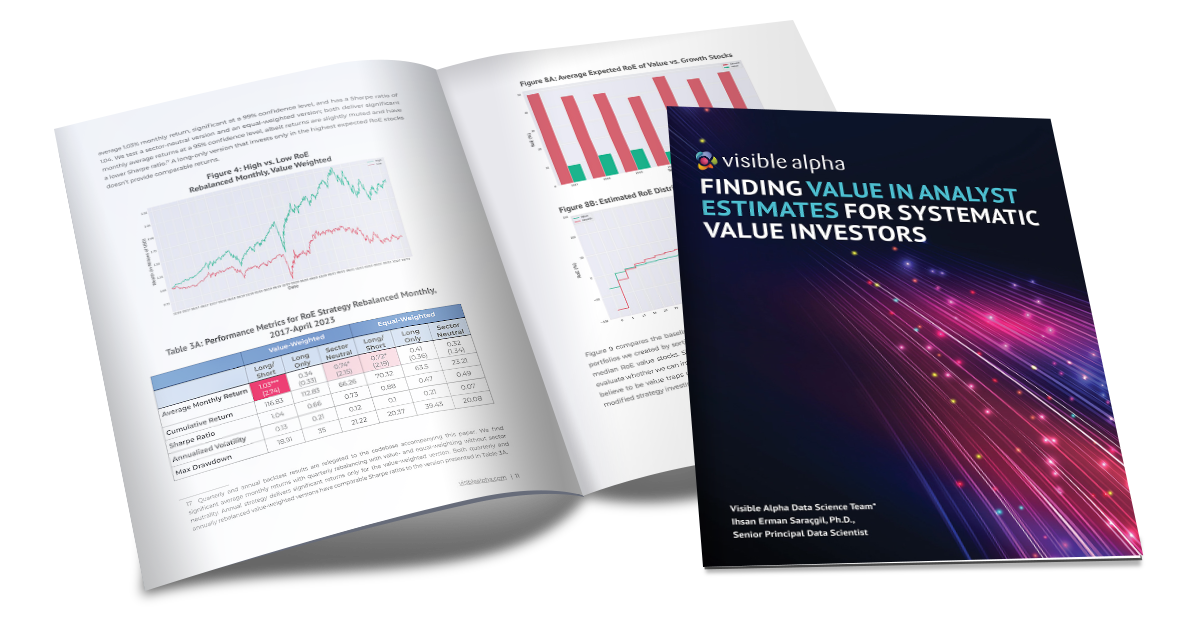
Finding Value in Analyst Estimates for Systematic Value Investors
In the ever-changing landscape of investments, avoiding the “value trap” is crucial. Navigate the complexities of investing with Visible Alpha’s report on systematic value investing – a powerful antidote to the “value trap.”
Frequently Asked Questions
Where is the data sourced?
Our data is sourced directly from sell-side analyst models. 200+ brokers contribute their spreadsheet models to Visible Alpha Insights, enabling us to capture every detailed line item analysts forecast in their coverage universe. For a full list of brokers, click here >
How do you create consensus?
We process full working models from the sell side; apply machine learning to extract all of the assumptions buried deep within analyst models; create detailed consensus models across all of a company’s products, segments, geographies and business drivers; and continually update consensus with every new analyst model and revision received. This provides you with a normalized view of all the relevant metrics and key drivers in a clean, comparable consensus model.
How is Visible Alpha different from other consensus estimates providers?
Our unique relationships with 200+ brokers give us access to their analysts’ full working models. While traditional consensus providers offer limited line items and forecast periods, Visible Alpha Insights has more consensus data on crucial line items, with higher source count and quality.
Does Visible Alpha add new companies to the platform?
We are continually adding new companies across the globe to the platform. Users can request coverage on any company from within the platform.
Does Visible Alpha ever onboard new brokers onto the platform?
We are always increasing coverage with new and current brokers. If a broker you work with is not contributing to our platform, we will work with you to onboard their content. If you are a broker who would like to start contributing content to Visible Alpha, please contact us.
Who uses Visible Alpha Insights?
Hedge funds, asset managers, corporations, investment banks, equity research departments, quantitative funds, independent research providers, private equity, wealth managers, family offices, academia and media outlets.


